 |
| Part 4 - Example architecture with GitOps |
The process was laid out how we approached the use case and how portfolio solutions are the base for researching a generic architecture. It continued by discussion how we approached the use case by researching successful customer portfolio solutions as the basis for a generic architecture.
Now it's time to look at one final example architecture.
This article walks you through an example architecture for using GitOps for providing a deployment and development example for edge medical diagnosis scenarios.
This article walks you through an example architecture for using GitOps for providing a deployment and development example for edge medical diagnosis scenarios.
Architecture review
As mentioned before, the architectural details covered here are based on real solutions using open source technologies. The example scenario presented here is a generic common architecture that was uncovered while researching those solutions. It's our intent to provide guidance and not deep technical details.
This section covers the visual representations as presented, but it's expected that they'll be evolving based on future research. There are many ways to represent each element in this architecture, but we've chosen a format that we hope makes it easy to absorb. Feel free to post comments at the bottom of this post, or contact us directly with your feedback.
This section covers the visual representations as presented, but it's expected that they'll be evolving based on future research. There are many ways to represent each element in this architecture, but we've chosen a format that we hope makes it easy to absorb. Feel free to post comments at the bottom of this post, or contact us directly with your feedback.
Now let's take a look at the details in this architecture and outline the solution for two views of the edge medical diagnosis architecture solution.
Edge medical diagnosis with GitOps
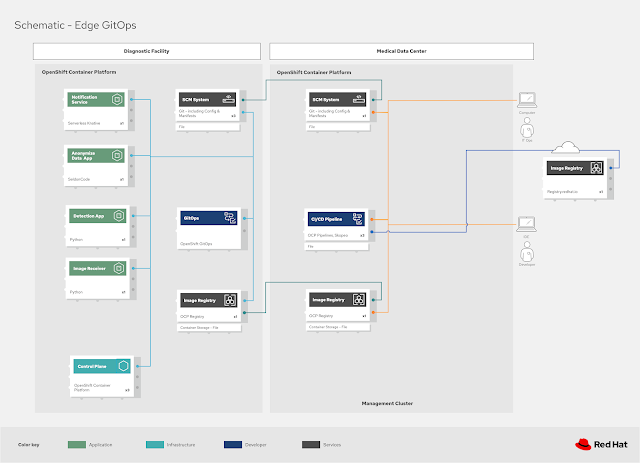
After touring the solution architecture and elements in the previous article related to actual edge medical diagnosis, this diagram shows us something entirely different. It's a matter of perspective and now we are looking at it from a development and operations perspective, using the lens of GitOps.
In the diagram above we start on the right side by the developer and IT operations users, who both are developing their own specific code bases. The developer is working on services, applications, and other integration aspects in their projects. Over in IT operations they are concerned with deployments and infrastructure as code for both agility and scalability, using for example configuration as code projects.
Both of these users are pushing their contributions into the source code management (SCM) system where it's then pulled into the CI/CD pipeline for the build processing which could require the use of, for example, standard base images from the remote image repository (shown here as the Red Hat repository).
These builds result in application and service images in the image repository for developers which is then pushed out to the subscribed diagnostic facilities in the field. For the IT operations you'll see their configuration and manifest code pushed out to the subscribed diagnostic facilities where they host source code management (SCM) systems in the field.
At this point we transition our discussion to the diagnostic facility where the field application of the medical diagnosis solutions are applied. A GitOps element can be found that uses Argo CD to manage specific resources, including images and operations code based configurations and manifests to define the management of users, deployments, and architectural behaviours.
Finally, we see this all come to fruition on the far left of this diagram as the control plane, a container platform based on OpenShift, hosts the various services and applications in their container-based runtimes.
Next up, a look at the architectural solution with a focus on the data view.
Edge medical diagnosis with GitOps (data)
Data connectivity through the edge medical diagnosis architecture with GitOps provides a different look at the architecture and gives us insights into how one of the most valuable assets of a healthcare organisation is being processed.
It should be seen as the architecture is intended, as a guide and not a definitive must-do-it-this-way statement on how the data is being routed through as actors are engaging with the systems, applications, and services in this architecture.
Note that many of the data flows only one direction while it's fairly obvious it's going to flow both ways. We've chosen to note that in the flows that do not disrupt the clarity of the architecture diagram, and chose not to indicate where the intent is to show processing and flows for clarity from actors to systems on the backend.
It's left to the reader to explore these data diagrams and feel free to send comments our way.
What's next
This was an overview of the specific pneumonia detection schematic diagrams that make up our architecture for the edge medical diagnosis use case.
An overview of this series on edge medical diagnosis architecture:
Catch up on any articles you missed by following one of the links above.
Catch up on any articles you missed by following one of the links above.
This completes the series and we hope you enjoyed this edge medical diagnosis architectural tour.


No comments:
Post a Comment
Note: Only a member of this blog may post a comment.