
This will be a bit of an overview, not each specific talk, covering what I saw and found interesting between the common discussions and chatting that happens between talks in the hallways. Often these overlapped session starting times and prohibit one from seeing everything at a conference.
I'll sort through the two day event by splitting my experience both as a speaker and attendee.
Day 1
The day started with updates from the Prometheus project and its ecosystem including PromQL. It featured a live demo using the recently open sourced project PromLens to showcase the new PromQL updates.
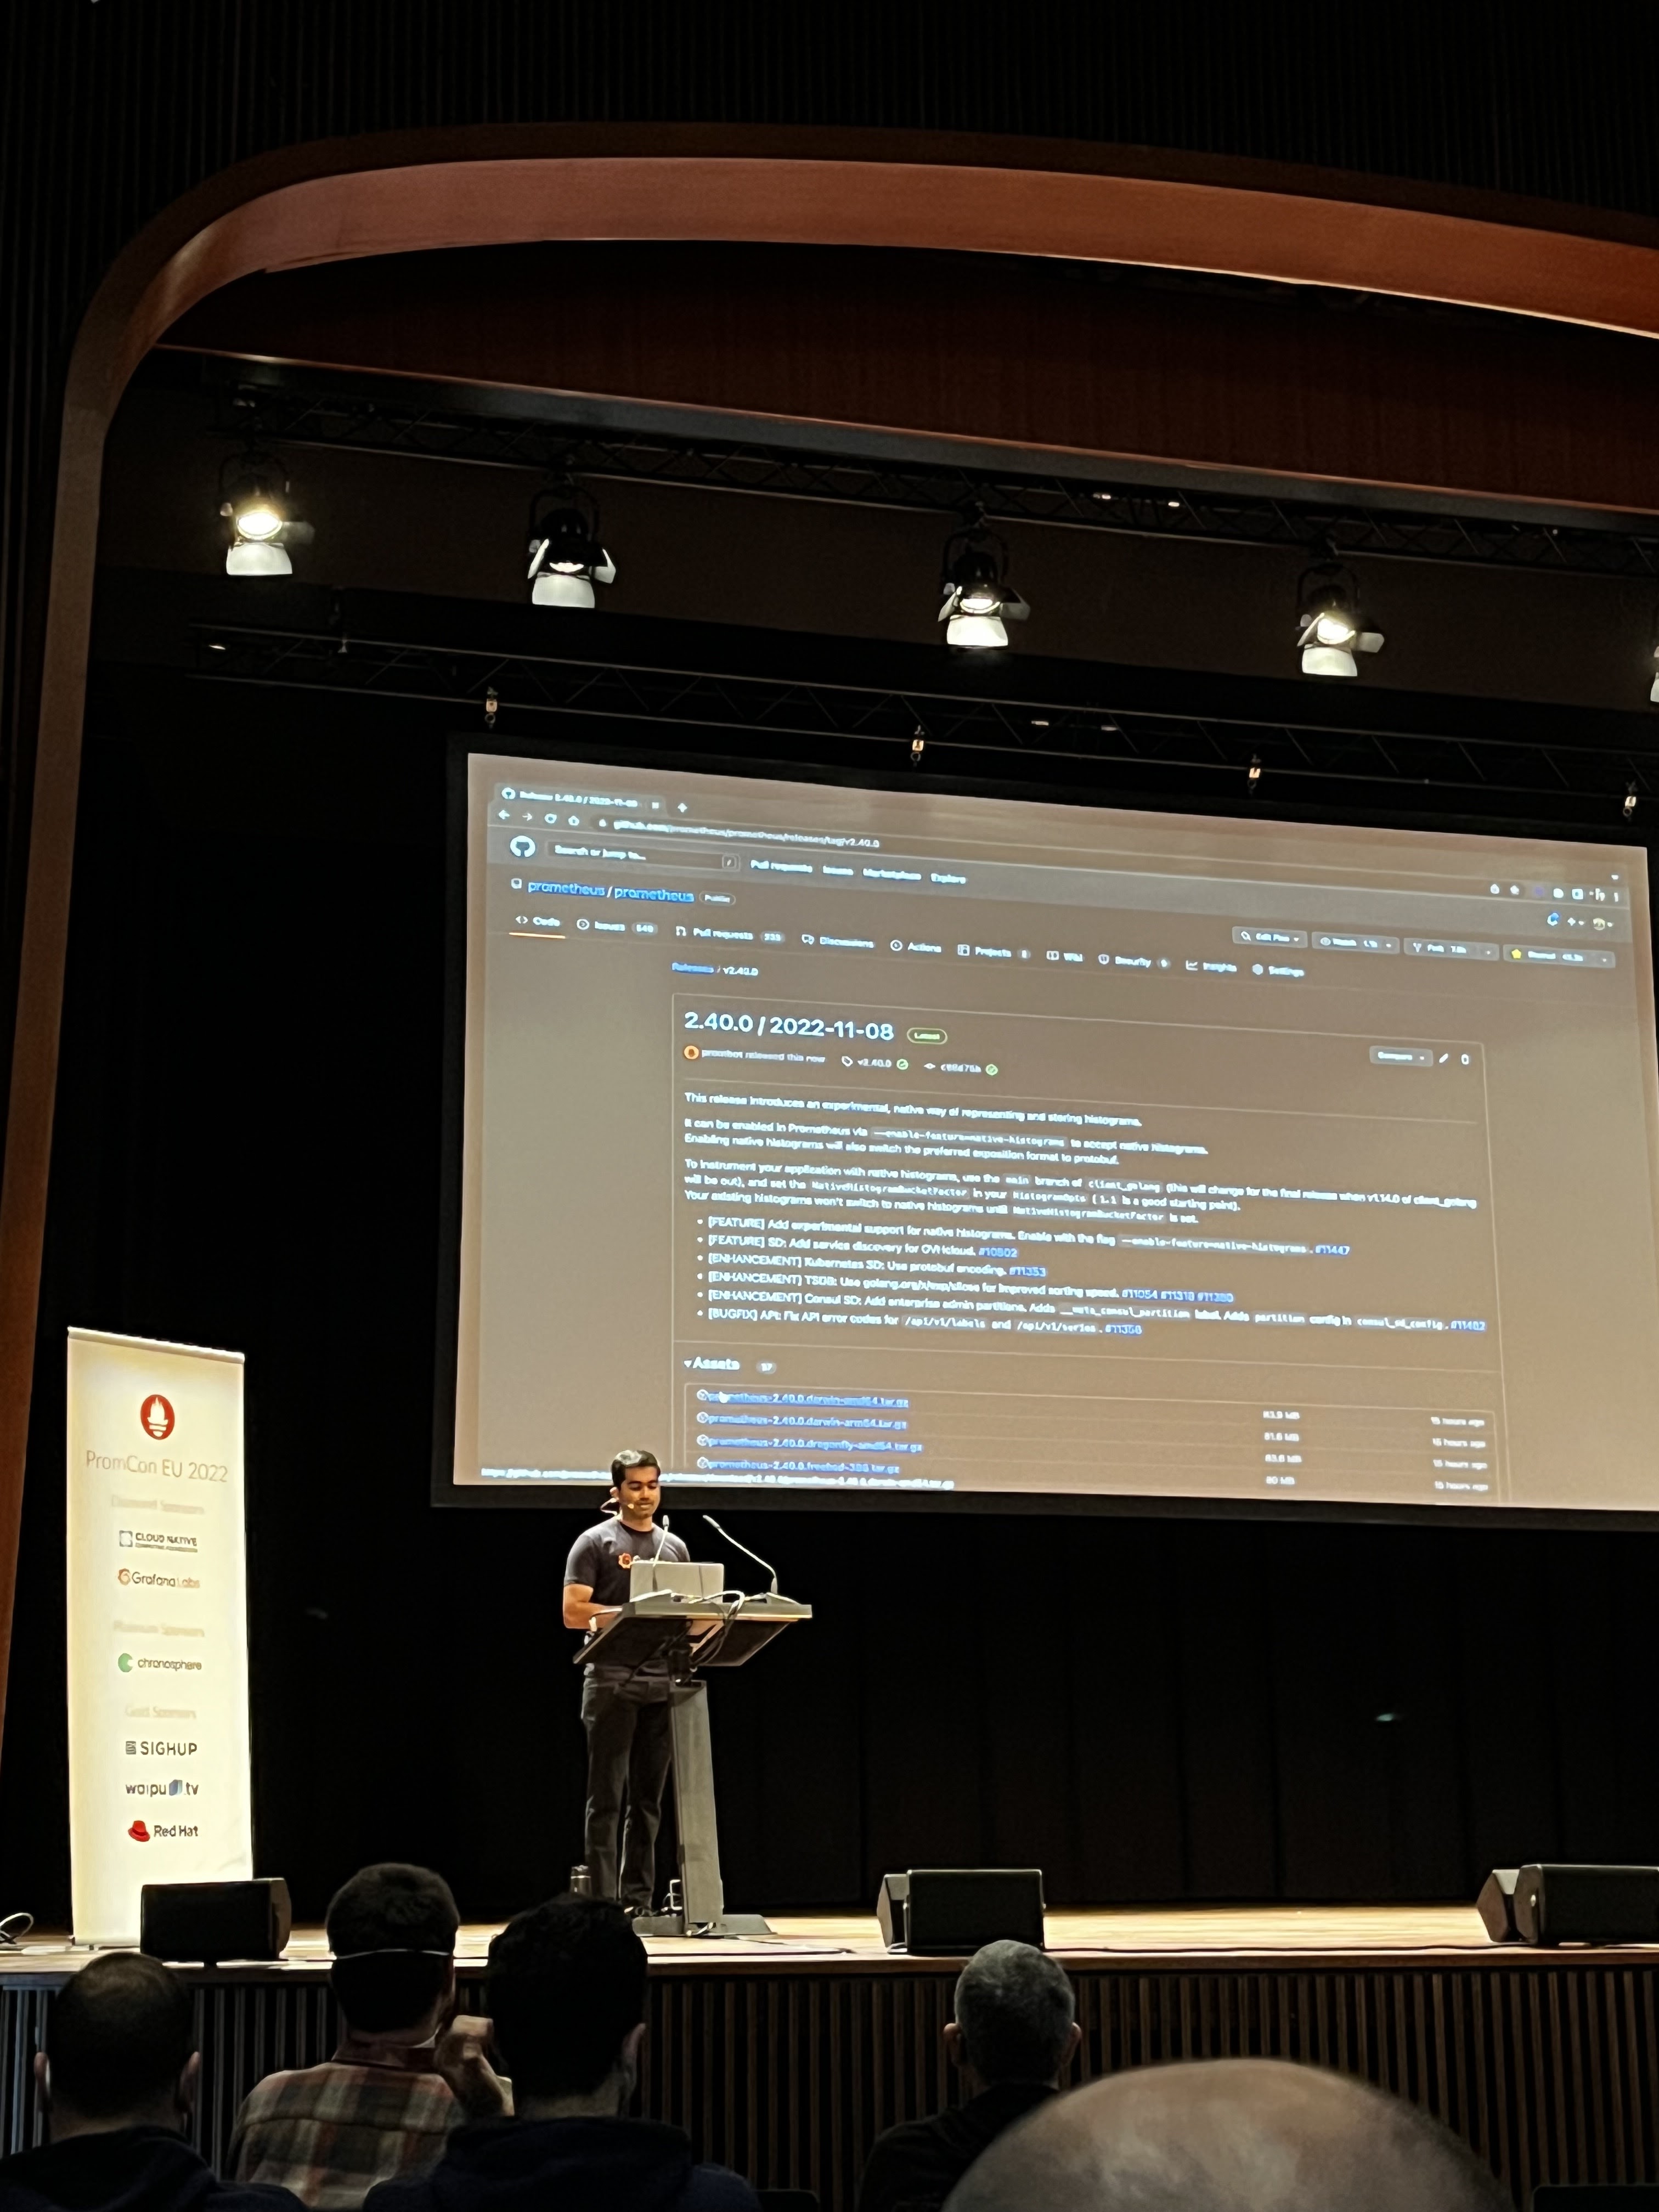 |
| Live on stage, released v2.4.0! |
The morning contained more updates across features within Prometheus. A deep dive into histograms and the various milestones both achieved and in their planning, followed by live releasing v2.4.0 of Prometheus with all the features from the talk. Nice touch! The final talk before the break was sharing PromQL updates that support the creation of histograms in a deep dive session,
Mid-morning one of the Prometheus co-founders, Julian Volz stepped in as a master of ceremony for the rest of the day. Nice touch to have an active introduction to each talk and break.
After lunch there was a very real retail use case where a German company was monitoring their point of sales (PoS) in their stores with NetBox and Prometheus. Always nice to see new usages for open source monitoring tools and this a hint at what you can expect with monitoring at the edge.
Prometheus is now able to deal with out of order time series metrics with remote write. This is a big change from the pull only architecture that Prometheus has been for years. Now with remote write they hope to make more complex architectures, such as federated Prometheus or isolated network instances, able to deal with out of order metrics data. Also event architectures and aggregation of metrics that are older would be two more cases you can imagine where you would like to be able to use out of order features. Note: this is not new for many of the vendors providing solutions for cloud native o11y at scale and aggregation down sampling of metrics data, such as Chronosphere.
In the last main stage talk before the closing series of lightning talks I presented on centralized versus decentralized metrics scraping at scale with Ales Koprivnikar on the main stage.
Centralized vs. decentralized - How Doordash collects Prometheus metrics
 |
| Live from the stage! |
In this session, we'll provide an overview of Prometheus metrics collection at DoorDash, where having highly reliable resources, easy endpoint discovery, and real-time insights is critical. They will share insights and best practices into DoorDash’s decision to implement a decentralized model by offering pros and cons of each approach. Leave with a better understanding of the “right” model for your use case(s).
My impression of the first day was that we had around 200 attendees, it was a great community event, very knowledgeable attendees who asked in depth questions along the way and plenty of time to chat in the hallway between sessions. I'm also a fan of the single track method of delivering the sessions, ensuring you don't miss much (unless deep diving in a side discussion).
Day 2
Opened with a very cool session on the history of the Prometheus project, from it's first commit in 2012 all the way through to the live release on stage yesterday in 2022. It's always nice to see the progression of a community and nice that someone puts that timeline to paper (session).

One of the nicest things about having in person events is the contacts you make around all the various technologies in the monitoring space. I've been playing with an open source project called Perses that is providing a project for designing and implementing your own highly performant dashboards.
I got onto their project chat channel and had been conversing with a knowledgeable team member who only had a chat handle, not his name displayed. We got to chatting about how to improve the getting started documentation and about how they might want to sign up for a lighting talk at PromCon EU.
It turned out this person was at the event and we met over coffee in a break. He turned out to be one of the founders of the project and was very nice to help answer all my questions. This is the power of open source and the natural sharing of ideas that it promotes and I'm pretty sure we might be collaborating a bit more soon on this project as I'd love to put together a workshop online teaching new users how to design their first dashboard using this project... stay tuned.
The rest of the morning was spent on sessions around the internals of PromQL, the query language used to access the monitoring data stored in Prometheus. From building a query analyzer to accelerate slow queries to redesigning the query language for scaleable computations. All were interesting and in depth enough that you are almost diving into research projects behind some of the great features found in the Prometheus project.

After lunch the sessions went into security, alerting, and even an OpenTelemetry session touching on tracing in your monitoring architecture. The day wrapped up with lightning talks and yes, they gave a small five minute lighting talk on the Perses project too.
Final impressions of this event left me with the feeling that the attendees are both passionate and knowledgeable about the metrics monitoring tooling around the Prometheus ecosystem. This event did not really have getting started sessions and most of this assumes you are coming for in depth dives into the various elements of the Prometheus project, almost giving you glimpses into the research progress behind features being improved in the coming versions of Prometheus.
Big kudos go to the organizers, it was well constructed and having new feature deep dives mixed with history sessions was only topped by the live release of version 2.4.0 of Prometheus on stage in the live feed for everyone to admire. It's well worth your time if you are active in the monitoring world, even if you are not using open source or Prometheus, you will gain insights into the status of features in the monitoring world.
No comments:
Post a Comment
Note: Only a member of this blog may post a comment.